Together, Under One Roof
Amy Miller
With the highest percentage of multigenerational households in the country, Hawai‘i is quite familiar with the idea of seeing multiple generations under one roof.
For a lot of families, this time of year becomes one of those special occasions when several generations come together, talk story and gather around the dinner table. In my family, days like Thanksgiving and Christmas became multi-day affairs. Everyone would get together again the day after for leftovers, which was sometimes a bigger event than the actual holiday, itself. We were taught by my grandmother to eat every grain of rice on our plates, as to leave even one grain was disrespectful to those who may be going without that same night. It’s a lesson that has stuck with me over the years; though, at the time I didn’t fully realize just how fortunate we were.
Here in Hawai‘i, the idea of seeing multiple generations under one roof isn’t reserved for just the holidays. In fact, nearly eight percent of households statewide are classified as multigenerational, where at least three family generations live in the same home. In many ways, this household structure represents one of the most beautiful things about Hawai‘i. It embodies the word ‘ohana and the concept of a larger family that extends far beyond the nuclear. The people within it are bound by a genuine sense of taking care of one another. Compassion, support, loyalty and aloha radiate throughout the home.
As parents often work multiple jobs to provide extra support, kūpuna may try to ensure the food security of their grandchildren by foregoing their own.
While tradition plays a significant role for many families’ decision to live together, Hawai‘i’s percentage of multigenerational households — the highest in the United States — can’t be entirely linked to cultural sensibilities. For a lot of families, it’s a necessity. Hawai‘i has the highest cost of living in the country, and the pandemic has only exacerbated the lack of affordable housing. In order to make rent, many local families have no choice but to pool their incomes just to get their foot in the door — and obstacles abound.
Obstacles like hunger.
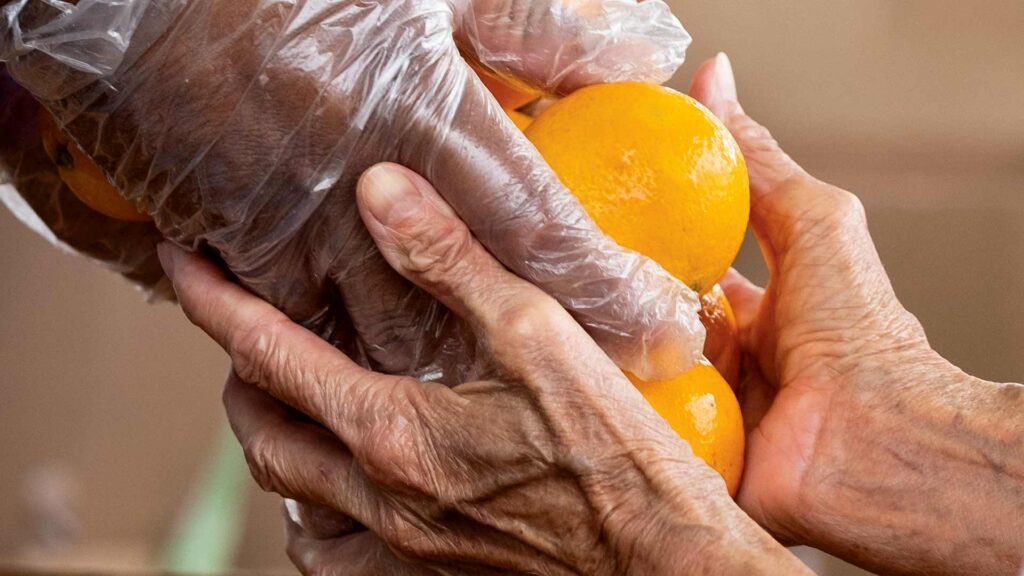
And hunger doesn’t affect everyone in the household equally. Keiki and kūpuna are especially vulnerable. Children who are malnourished are less able to focus in school, less likely to reach their full potential and more at risk for illness. To avoid this, parents and kūpuna try hard to shield their keiki from hunger. As parents often work multiple jobs to provide extra support, kūpuna may try to ensure the food security of their grandchildren by foregoing their own — to the point where grandparents in multigenerational households can experience hunger at more than twice the rate of those in homes with no grandchildren. Even at their own expense, members of the household never lose sight of what it means to take care of one another.

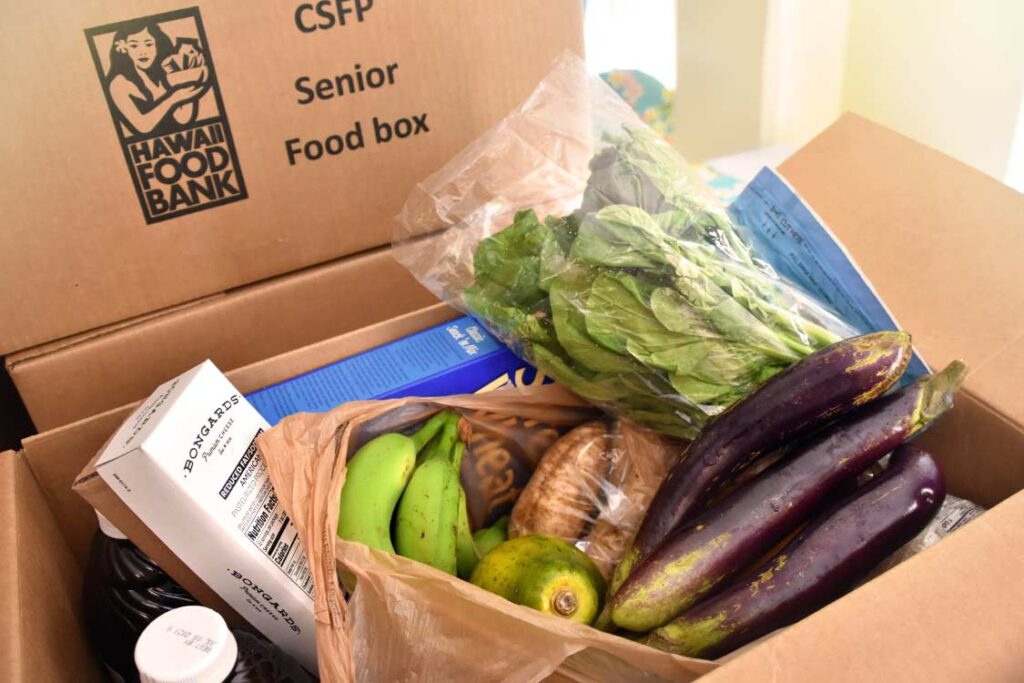
Grandparents in multigenerational households can experience hunger at more than twice the rate of those in homes with no grandchildren. To help ensure every member of the household has the nourishment they need, Hawai‘i Foodbank offers nutritional support through programs like ‘Ohana Produce Plus, the Senior Food Box Program and more.
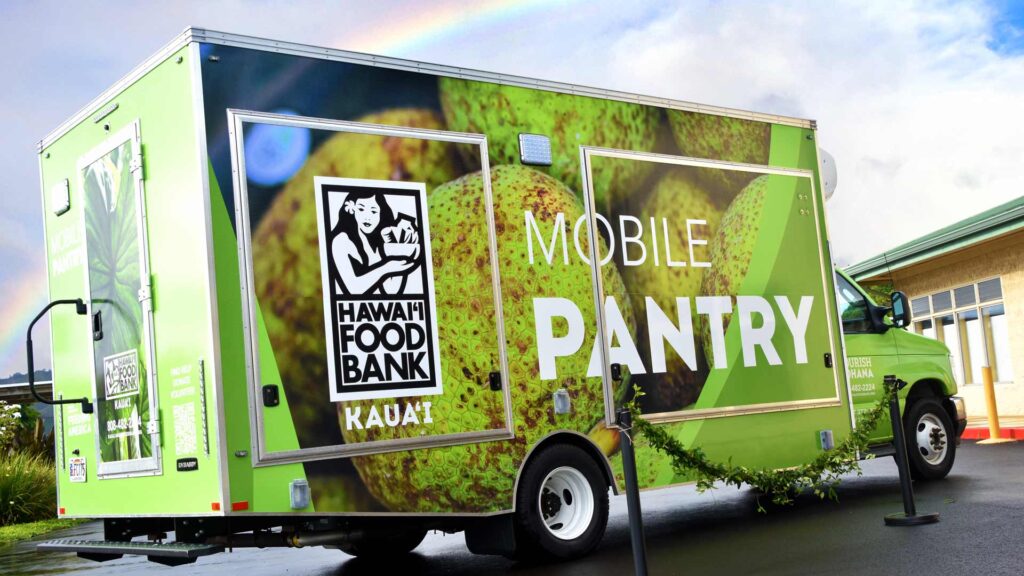
Hawai‘i Foodbank is here to help take care of them. It is our mission to ensure every member of our ‘ohana has the nourishment they need to thrive. We are doing so by expanding established programs like ‘Ohana Produce Plus and Food 4 Keiki while also investing resources in new initiatives like Kūpuna Fresh. We are working closely with our network of more than 200 food partner agencies to provide food for families affected by the pandemic while continuing to provide assistance to those who were already struggling with hunger. This last year, we distributed food for more than 19.4 million meals — and we’re only able to do this because of people like you.
Hawai‘i Foodbank will continue to be here to ensure our keiki have the opportunity to grow, learn and thrive without impossible sacrifices from the rest of their families.
As I think about this, I cannot help but reflect on the lessons I learned from my grandmother during the holidays. Just as this time of year is about coming together, our community’s steadfast support reminds us what it means to stand together and take care of one another. With the help of countless generous donors, volunteers, community partners, food drives and fundraisers — Hawai‘i Foodbank will continue to be here to ensure our keiki have the opportunity to grow, learn and thrive without impossible sacrifices from the rest of their families.
As we look toward the holiday season and 2022, let’s keep coming together to help families achieve long-term food security and address the nutritional needs of each generation. Together, we can ensure that no one in the household goes hungry.

